The New York Mets
Here are the top
ten Mets of all time using the Bill James Win Share ranking
system.
To see #s 11 through 20, click here.
An asterisk (*)
after a Win Share total indicates that this was the leading
total for the team that year. In other words, the player
was probably the team MVP or close to it that year. A
player gets +2 subjective points added to the calculation
for each year he leads the team in Win
Shares.
#1
Tom Seaver (RHP) / Player’s Score = 188
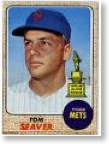
Innings Pitched: 3,045
Seaver's
annual Win Share totals in a Met uniform are:
1967 (21*);
1968 (23); 1969 (32*);
1970 (25*);
1971 (32*);
1972 (22*);
1973 (29*);
1974 (16); 1975 (26*);
1976 (20); 1977 (8); 1983 (12).
Here is his Win Share ranking calculation as
explained here:
25.78 (career total) + 31 (avg. three best yrs.) + 28 (avg.
five best consecutive yrs.) + 14.4 (age adjustment) + 16
(subjective factor) = 115.18
Seaver’s annual Wins Above Replacement totals in a
Met Uniform are:
1967 (5.8); 1968 (6.7); 1969 (7.1); 1970 (5.4); 1971 (9.7);
1972 (4.9); 1973 (10.3); 1974 (5.9); 1975 (7.5); 1976
(5.1); 1977 (2.3); 1983 (2.2) = 72.9
#2
David Wright (3B) / Player’s Score =
149
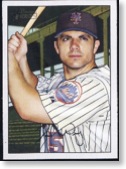
Despite the moneyball operation underway at the Mets, the six-time All-Star's newly minted contract will now make him a Met for the rest of his career enabling him to stretch out his record margins in every meaningful offensive category. Could David Wright ever overhaul Tom Seaver for the number 1 slot on this list? It is possible, but the second half of his career would need to be almost as productive as his first half, a feat not often achieved in the decline phase of a baseball career.
Plate Appearances: 5,435
Wright's annual Win Share totals in a Met uniform: 2004 (9); 2005 (26*); 2006 (30); 2007 (34*); 2008 (27); 2009 (20*); 2010 (25*); 2011 (14), 2012 (30*)
Here is his Win Share ranking calculation as explained here:
23.12 (career total) + 31.3 (avg. three best yrs.) + 27.4 (avg. five best consecutive yrs.) + 18.2 (age adjustment) + 10 (subjective factor) = 110.02
Wright’s annual Wins Above Replacement totals as a Met are:
2004 (2.0); 2005 (4.5); 2006 (3.8); 2007 (8.1); 2008 (6.7); 2009 (2.9); 2010 (2.5); 2011 (1.9); 2012 (6.7) = 39.1
#3
Darryl Strawberry (RF) / Player’s Score =
132
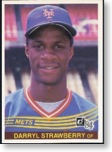
In the years between 1983 and 1991 Strawberry was polishing a plaque in the Baseball Hall of Fame. After that time he was never again a regular player. His problems are well documented and won't be repeated. A tragic story. For our purposes, if there's anything good about Strawberry's story, 8 of those good 9 years were spent in a Met uniform. He came in 2nd in the MVP voting in 1988 and 3rd in the voting in 1990. He was a 7-time Met All-Star and, at the beginning of the 2013 season, is still the all-time Met leader in Home Runs (252).
Plate Appearances: 4,549
Strawberry's annual Win Share totals in a
Met uniform are:
1983 (18); 1984 (24); 1985 (24); 1986 (25); 1987
(30*); 1988 (30); 1989 (18);
1990 (26*).
Here is his Win Share ranking calculation as
explained here:
21.91 (career total) + 28.67 (avg. three best years) + 26.6
(avg. five best consecutive years) + 16.2 (age adjustment)
+ 4 (subjective factor) = 97.38
Strawberry’s annual Wins Above Replacement totals in
a Met uniform are:
1983 (2.4); 1984 (2.5); 1985 (4.6); 1986 (3.1): 1987 (6.1);
1988 (5.1); 1989 (4.6); 1990 (6.0) = 34.4
#4
Edgardo Alfonzo (3B - 2B) / Player’s Score = 129
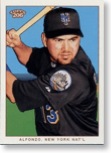
My guess is that Alfonzo will remain in the #4 slot for quite awhile.
Plate Appearances: 4,449
Alfonzo's annual Win Share totals in a Met
uniform are:
1995 (8); 1996 (6); 1997 (28*); 1998 (22); 1999 (29); 2000
(36*); 2001 (15); 2002 (26*).
Here is his Win Share ranking calculation as
explained here:
20.20 (career total) + 31 (avg. three best years) + 26.0
(avg. five best consecutive years) + 17.3 (age adjustment)
+ 6 (subjective factor) = 100.5
Alfonzo’s annual Wins Above Replacement totals in a
Met uniform are:
1995 (0.6); 1996 (0.9); 1997 (6.0); 1998 (2.4); 1999 (5.9);
2000 (6.1); 2001 (1.3); 2002 (4.8) = 28
#5
Carlos Beltran (CF) / Player’s Score = 125
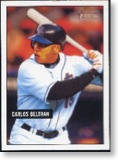
Beltran finishes his seven years as a Met with one of the most productive records on file. On the whole, Carlos Beltran has turned out to be a wonderful acquisition if one subtracts out the missed season to injury. Although he had knocked in 100 runs in a season five times before the Mets got him, he has had his best years under the bright lights of New York. He has hit career season highs in Home runs, RBIs and batting average as a Met. In his seven Met years he has been an All-star 4 times, Gold Glove winner 3 times, and Silver slugger twice. Carlos Beltran appears to be safely ensconced as the #5 Met of all time for long while.
Plate Appearances: 3,640
Beltran's annual Win Share totals in a Met
uniform are:
2005 (21); 2006
(34*); 2007 (25); 2008 (29*);
2009 (14); 2010 (8), 2011 (19).
Here is his Win
Share ranking calculation as explained here:
18.75 (career
total) + 29.33 (avg. three best yrs.) + 24.6 (avg. five
best consecutive yrs.) + 17.7 (age adjustment) + 4
(subjective factor) = 94.38
Beltran’s annual Wins Above Replacement totals in a
Met uniform are:
2005 (2.7); 2006 (8.0); 2007 (5.2); 2008 (6.7); 2009 (3.5);
2010 (0.6); 2011 (3.5) = 30.2
#6
Keith Hernandez (1B) / Player’s Score = 117
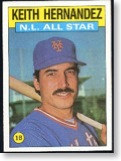
Perhaps Tim McCarver said it best on page 205 of Oh Baby, I Love It!
With Kooz, Hojo, Doc, and Keith all stacked together pretty tightly one could make a good argument that any of these players could be ranked 6 through 9.
Plate Appearances: 3,684
Hernandez's annual Win Share totals in a
Met uniform are:
1983 (16); 1984 (33*);
1985 (27); 1986 (29*);
1987 (21); 1988 (13); 1989 (3).
Here is his Win Share ranking calculation as
explained here:
18.11 (career total) + 29.67 (avg. three best yrs.) + 25.2
(avg. five best consecutive yrs.) + 15.3 (age adjustment) +
4 (subjective factor) = 92.28
Hernandez’ annual Wins Above Replacement totals in a
Met uniform are:
1983 (4.2); 1984 (6.0); 1985 (4.7); 1986 (5.2); 1987 (3.1);
1988 (2.0); 1989 (-0.2) = 25
#7
Jerry Koosman (LHP) / Player’s Score =
116
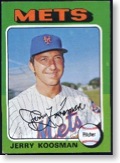
Other than Seaver, Koosman has benefited more than any other player from subjective factor points. He gets +4 for leading the team in Win Shares twice and +3 for World Series play. Between the 1969 and the 1973 World Series' Kooz is 3-0 with a 2.39 ERA in 26+ Series innings. He has the best pitching record of any Met in World Series play.
Innings Pitched: 2,544
Koosman's annual Win Share totals in a Met
uniform are:
1967 (0); 1968 (23*);
1969 (25); 1970 (14); 1971 (9); 1972 (5); 1973 (18); 1974
(17); 1975 (13); 1976 (20*);
1977 (11); 1978 (8).
Here is his Win Share ranking calculation
as explained here:
19.74 (career total) + 22.67 (avg. three best yrs.) + 15.8
(avg. five best consecutive yrs.) + 14.2 (age adjustment) +
7 (subjective factor) = 79.21
Koosman’s annual Wind Above Replacement totals are:
1967 (-0.5); 1968 (6.2); 1969 (5.8); 1970 (2.7); 1971
(2.1); 1972 (0.3); 1973 (5.5); 1974 (4.7); 1975 (1.9); 1976
(4.4); 1977 (2.7); 1978 (1.2) = 37
#7
Howard Johnson (3B) / Player’s Score = 116
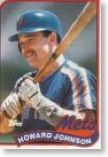
Hojo was an extremely versatile player which cut both ways on his performance. Although he played the great bulk of his time at third for the Mets he also put in 1,500 innings at shortstop and more than 1,000 innings in the outfield during his Met days. Unfortunately, he didn’t play any position all that well. His defensive WAR knocked almost 11 points off his career Met WAR total. Had Johnson been even an average fielder he would have been up at #4 all-time.
Given all the above, in Whitey Herzog's You're Missin' a Great Game
Plate Appearances: 4,591
Johnson's annual Win Share totals in a Met
uniform are:
1985 (11); 1986 (10); 1987 (24); 1988 (21); 1989
(38*); 1990 (24); 1991 (25*);
1992 (10); 1993 (6).
Here is his Win Share ranking calculation as
explained here:
17.28 (career total) + 31.67 (avg. three best yrs.) + 26.4
(avg. five best consecutive yrs.) + 16 (age adjustment) + 4
(subjective factor) = 95.57
HoJo’s annual Wins Above Replacement totals in a Met
uniform are:
1985 (0.4); 1986 (1.2); 1987 (4.1); 1988 (3.3); 1989 (6.8);
1990 (2.1); 1991 (3.1); 1992 (-1.5); 1993 (0.8) = 20.3
#7
Dwight Gooden (RHP) /
Player’s Score = 116
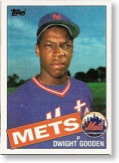
At age eleven, Gooden started pitching and began to understand the gift in his right arm. In high school he blossomed into and incredible player both pitching and hitting. He acquired the nickname "Doc" because of the way he would methodically dissect hitters.
Gooden was scouted by several major league teams in high school and was eventually signed by the Mets as their #1 pick in 1982. Gooden played in the minors at Kingsport and Lynchburg. He was promoted to the big leagues in 1984.
Gooden's 1984 and 1985 seasons were among two of the best rookie and sophomore seasons on record. He won the Rookie of the Year Award, broke Herb Score's 1955 record for the most strikeouts by a rookie, became the youngest All-Star game starting pitcher of all time, should have won the 1984 Cy Young Award, won the Cy Young Award easily in 1985 (he was the youngest ever to win the award), and had the lowest starting pitcher ERA since Bob Gibson's 1.12 ERA in 1968 (and the lowest thereafter to date). Not only had Gooden arrived, but the Mets had gelled as a team.
He pitched well in 1986, but was nowhere near his performance in '85. The reason for Gooden's performance drop? Alcohol. Gooden had started to drink heavily with other teammates after almost every game of the 1986 season. All that alcohol took the movement off of his famous fastball. His playoff performance in '86 was plainly subpar.
Gooden's first contact with cocaine came almost immediately after the end of the 1986 World Series. During a cycle of post-World Series celebrations he went on numerous drinking binges. During one of these binges he opened the "front door to hell." He tried cocaine once, then waited a few days, then tried it again, then started twice a week, then three times a week. He was arrested in a scuffle with police in December 1986 and suddenly he was on a path that was to eventually ruin his baseball career.
On March 24, 1987, Gooden agreed to routine drug testing as part of his contract. He got high on March 25th and the trainer showed up for Gooden's drug test on March 26. He flunked the test. Gooden entered rehab and remained cocaine free thereafter for seven long years. Still drinking routinely, Gooden's career began to slowly slip. He turned again to cocaine in the summer of 1994 and was subject to a 60-day suspension. Between the suspension and the baseball player's strike, Gooden's 1994 was finished. With nowhere to go and nothing much to do he became a very serious coke addict, failing numerous subsequent drug tests. The Mets released Gooden and soon thereafter Baseball Commissioner Bud Selig suspended him for the entire 1995 season.
Looking at his Win Share totals it seems sad to say that he really only had one great, two very good, and 5 ok years as a Met. Gooden gets +2 subjective factor for his on-field leadership in leading the team in Win Shares in 1985, but gets -2 for ruining his 1994 season and ending his career with the Mets.
Check out Gooden's honest reflections on his own career in Heat: My Life on and Off the Diamond.
Innings Pitched: 2,169
Gooden's annual Win Share totals in a Met uniform are:
1984 (18); 1985 (33*); 1986 (17); 1987 (14); 1988 (13); 1989 (8); 1990 (13); 1991 (13); 1992 (11); 1993 (14); 1994 (0).
Here is his Win Share ranking calculation
as explained here:
19.06 (career total) + 22.67 (avg. three best yrs.) + 19
(avg. five best consecutive yrs.) + 16.4 (age adjustment) +
0 (subjective factor) = 77.13
Gooden’s annual Wins Above Replacement totals are:
1984 (5.2); 1985 (11.9); 1986 (4.2); 1987 (3.5); 1988
(3.1); 1989 (1.4); 1990 (2.2); 1991 (3.0); 1992 (2.1); 1993
(3.3); 1994 (-0.6) = 39.3
#10
Jose Reyes (SS) / Player’s Score = 115
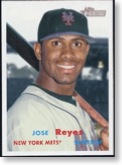
In all due respect to Bud Harrelson, Jose Reyes is the best shortstop that has ever worn a Met uniform. In his nine seasons as a Met, Reyes is a 4-time All Star and the first NY Met ever to win the NL Batting title. He has also led the NL in triples 4 times and stolen bases 3 times. He has had 190+ hits for four years in a row; has scored 99+ runs for five of his nine Met years; and polled in the MVP voting for five of his nine Met years. Before his 2009 injury he was one of the best lead-off hitters in the NL. He got hurt in 2009 after a fairly typical start. His injury erased the back half of the 2009 season. Reyes returned to full-time play in 2010 and played solidly if certainly not the Reyes of old. His great 2011 season made him more valuable as a bargaining chip than as a future Met in a rebuilding program. The curtain came down on a great Met career at the end of 2011.
Plate Appearances: 4,840
Reyes's annual Win Share totals in a Met
uniform are:
2003 (12); 2004 (5); 2005 (17); 2006 (28); 2007 (24); 2008
(28); 2009 (5), 2010 (19); 2011 (26*).
Here is his Win Share ranking calculation as
explained here:
19.80 (career total) + 27.33 (avg. three best yrs.) + 20.8
(avg. five best consecutive yrs.) + 18.3 (age adjustment) +
2 (subjective factor) = 88.23
Reyes’ annual Wins Above Replacement totals in a Met
uniform are:
2003 (2.2); 2004 (0.4); 2005 (1.4); 2006 (5.6); 2007 (5.0);
2008 (4.7); 2009 (0.8); 2010 (2.2); 2011 (4.7) =
27
